

How to Design Your Website for Google Analytics
You have undoubtedly heard about designing your website for your users (UX design), conversions (conversion optimization), and search engines (SEO), but what about Analytics?
Below are a number of considerations to ensure your website data is as easy as possible to track in Google Analytics. The good news is that most of these tips and tricks are already best practices for user experience, SEO or conversion optimization anyway!
Build With Folders and Subfolders Not Subdomains
Cross-domain and subdomain tracking can get complicated in Google Analytics. It’s easy to get erroneous data because of bad referrers especially when your business spans multiple subdomains or domains. Tracking a single domain per property is the simplest implementation and results in the most accurate data.
As long as it makes sense for your business, move your blog and/or e-commerce and any other subdomains to a single, main domain to track patterns across the entire user journey from when they inbound on a blog post to when they make a purchase.
Implement Folder Groups Based on Users, Content Categories or Buyer Funnel
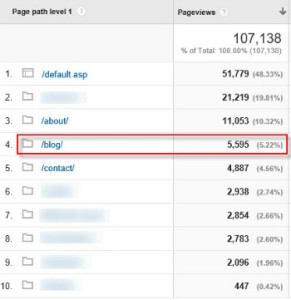
Build out the pages in your architecture based on relevant and useful classifications for your business and use the Content Drilldown report to view performance based on those classifications.
For example, if you have multiple audiences for your website based on skill level and it’s important to get insights based on user identification, ask users to self-identify as a “hobbyist” or “professional” and provide pages relevant to them under the appropriately designated folders.
If you’re running a site that’s primary purpose is content delivery (blog, recipes, etc.) do this with content categories to determine which content is most popular. Is it more useful for you to group your recipes by meal, ingredient or season to gain actionable insights?
You could even map folders or subfolders to buyer funnel steps (e.g., information, consideration, decision) to get insights into the content engagement for each process step.
Blog posts usually inbound prospects early in the funnel, during the information gathering phase. From the image shown here we can see that the blog folder only gets 5.29% of the pageviews.
That might indicate that there should be an increased emphasis on generating top-of-funnel blog content and distribution strategies to increase engagement at that step in the funnel.
No Long Scrolling Pages
Long, scrolling pages may be en vogue, but they certainly make gathering clickstream data difficult when there’s nowhere to click!
Sure, you can setup a heatmap tool relatively inexpensively (and you should probably do this anyway), but make sure each each page includes several potential user interactions such as: form submissions, linked calls to action, videos or content to download.
You can track page views (like the thank you page from a form submission) with the default Google Analytics setup by configuring a destination URL goal. You can also track events like downloads and button clicks using event tracking. Event tracking requires some custom javascript implementation, so you’ll want to work with a developer to do this.
Use Form Thank You Pages
If you use Gravity forms in WordPress, the default setting for the confirmation message is an in-line notification. Google Analytics can’t track that, so make sure to create a unique thank you page for each lead generation form and set these up as destination goals in Analytics.
Implement Site Search
Users’ search queries can be gathered in an analytics report but only if you have site search functionality on your website. Search query information can be very helpful in identifying the needs and intentions of the visitors on your website.
If a search term comes up frequently, consider placing the content in the main navigation. Often people will enter queries in the form of a question. This can help you identify what information you should add to your website based on what people think should be there.
Include a Privacy Policy
Enabling Google’s demographics and interests reports can provide more insights into your users, however, in order to access this data and be in compliance with Google, you must include a privacy policy on your website with information about cookies. It takes around 15 minutes to create a privacy policy using any number of free online tools.
Get Our “Website Design for Google Analytics” Checklist
Click the “download” button below and print or email these steps to yourself or your favorite website developer or designer!

